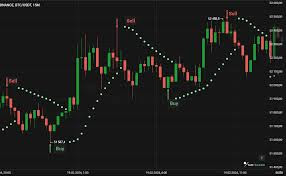
What is the Parabolic SAR?
The Parabolic SAR (Stop and Reverse) is a technical analysis tool developed by J. Welles Wilder to help traders determine the direction of a trend and identify potential trend reversals in the market. This indicator works best in markets that are trending. The term "SAR" refers to its two main functions: "Stop" (indicating when to stop) and "Reverse" (signaling a potential reversal).
How the Parabolic SAR Works
The Parabolic SAR is displayed as a series of dots either above or below the candlesticks on a price chart. The position of these dots gives signals about the potential trend direction:
- Dots Below the Candlesticks: This suggests the market is in an uptrend.
- Dots Above the Candlesticks: This indicates the market is in a downtrend.
Setting Up the Parabolic SAR
To set up the Parabolic SAR on MetaTrader 4 or MetaTrader 5, follow these steps:
- Open the MetaTrader Platform: Choose the currency pair or asset you want to analyze.
- Add the Parabolic SAR Indicator:
- Go to the “Chart” menu.
- In the "Navigator" panel, choose the "Trend" folder from the "Indicators" list.
- Double-click on "Parabolic SAR."
- Adjust Indicator Settings:
- Step: Defines the acceleration factor size. The standard value is usually 0.02. This factor will progressively increase until it reaches a maximum value of 0.20.
- Maximum: Sets the upper limit for the acceleration factor.
Key Components of the Parabolic SAR
- Extreme Point (EP): The highest or lowest price reached during the current trend.
- Significant Point: The highest or lowest price within a given time period.
- Acceleration Factor (AF): A multiplier used to establish the location of the SAR points on the chart.
When to Use the Parabolic SAR
- Determining Trend Direction: The Parabolic SAR helps identify the current trend direction. Dots below the price suggest an uptrend, while dots above the price signal a downtrend.
- Identifying Potential Trend Reversals: When the SAR dots shift from below to above the candlesticks (or vice versa), it may signal a potential trend reversal.
- Identifying Entry and Exit Points:Some aggressive traders use the Parabolic SAR as a trigger to enter or exit trades. However, since the indicator works best in trending markets, it’s recommended to combine it with other analysis tools to confirm signals.
The Parabolic SAR is a valuable tool for determining trend direction and potential reversals in trending markets. By understanding how it works and setting it up correctly, traders can use it to make more informed trading decisions. For optimal results, it's best to use the Parabolic SAR alongside other technical indicators and a comprehensive market analysis strategy.

